





Hi,
I was looking for some hotspots in order to take pictures of lightnings (taking all possible security measure of course) and I could not find any good way of accessing to this information.
I wrote a script in order to extract the CSV data and to stich them temporally and I reprocessed the data afterward into Mathematica. Doing so I managed to generate the attached pictures.
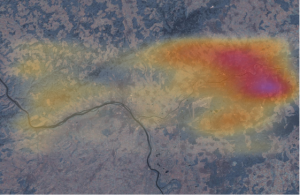
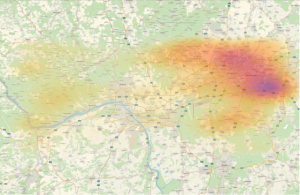
For those interested in local density plot.
Below the script written in Python using the Selenium library. This script needs to be edited in order to perform your task, you need to define:
Best regards
Antoine
I was looking for some hotspots in order to take pictures of lightnings (taking all possible security measure of course) and I could not find any good way of accessing to this information.
I wrote a script in order to extract the CSV data and to stich them temporally and I reprocessed the data afterward into Mathematica. Doing so I managed to generate the attached pictures.
For those interested in local density plot.
Below the script written in Python using the Selenium library. This script needs to be edited in order to perform your task, you need to define:
- The location of your chromedriver
- The download path
- Your login on Blitzortung
- Your password on Blitzortung
- The start date for the data collection
- The min/max latitude and longitude of the area of interest
Code:
#!/usr/bin/python3

import time
import datetime

from selenium import webdriver

from selenium.webdriver.support.ui import WebDriverWait
from selenium.webdriver.support import expected_conditions
from selenium.webdriver.common.by import By

path_download     = ""
path_chromedriver = "" #were chromedriver is stored download at https://chromedr
iver.chromium.org/downloads
login       = ""       #your login
pwd         = ""       #your path
start_year  = 2015     #when to start
start_month = 6        #idem
start=day   = 1        #idem
lon_min     = 49.2     #longitude min
lon_max     = 50.2     #longitude max
lat_min     = 7.8      #latitude min
lat_max     = 8.9      #latitude max


options = webdriver.ChromeOptions() ;
prefs = {"download.default_directory" : path_download}
options.add_experimental_option("prefs",prefs);

driver = webdriver.Chrome(executable_path = path_chromedriver, chrome_options=op
tions)

wait = WebDriverWait(driver, 30);

driver.get("https://www.blitzortung.org/en/login.php")
time.sleep(1.)
driver.find_element_by_xpath("/html/body/div[2]/div/p[3]/span/span[5]").click()
driver.find_element_by_name("login_username").send_keys("EMP_22")
time.sleep(0.2)
driver.find_element_by_name("login_password").send_keys("EFM_27")
time.sleep(2.)
driver.find_element_by_class_name("center").click()
driver.find_element_by_xpath("//input[@type='submit']").click()


date_start = datetime.datetime(start_year,  start_month,  start_day, 0, 0, 0)
for i in range(2000):
    date_end   = date_start+datetime.timedelta(days=2)
    if date_end > datetime.datetime.now():
        exit()

    epoch_start = int(date_start.timestamp())
    epoch_end   = int(date_end.timestamp())

    http_address  = "https://www.blitzortung.org/en/archive_data.php?stations_us
ers=0&selected_numbers=*"
    http_address += "&end_date=" + str(epoch_end)
    http_address += "&end_time=" + str(0)
    http_address += "&start_date=" + str(epoch_start)
    http_address += "&start_time=" + str(0)
    http_address += "&rawdata_image=0"
    http_address += "&north=" + str(lon_max)
    http_address += "&west="  + str(lat_min)
    http_address += "&east="  + str(lat_max)
    http_address += "&south=" + str(lon_min)
    http_address += "&map=0&width_orig=640&width_result=640&agespan=60&frames=12
&delay=100&last_delay=1000&show_result=1"
    driver.get(http_address)
    driver.switch_to.frame(0)
    #time.sleep(5.)
    print(date_start)
    print(date_end)
    #filename_out = date_start.strftime("%Y%m%d")+"_"+date_end.strftime("%Y%m%d"
)+".csv.gz"

    elt = driver.find_element_by_xpath("//a[contains(@href,'raw')]")#.get_attrib
ute('href'))
    elt.click()

    driver.switch_to.default_content();
    time.sleep(0.5)
    date_start = date_end

driver.close
driver.quit()
Best regards
Antoine
![[Image: NOAARADlogoTXT80.png]](https://noaaweatherradio.org/icons/NOAARADlogoTXT80.png)