2020-04-06, 11:04
Hello Egon,
I've two questions to statistics_2b.
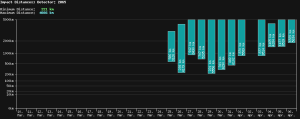
1) Would it be possible to show distances beyond 5000 km in the diagram?
2) The minimum distance printed top left of the diagram matches with the bars. The maximum distance in the bars shows higher values than the one printed top left. What is the meaning of the maximum distance and why is there a difference?

Klaus
I've two questions to statistics_2b.
1) Would it be possible to show distances beyond 5000 km in the diagram?
2) The minimum distance printed top left of the diagram matches with the bars. The maximum distance in the bars shows higher values than the one printed top left. What is the meaning of the maximum distance and why is there a difference?
Klaus


